

An infographic is a form of content marketing that helps you turn a complicated matter into a simplified and fascinating experience. You have probably seen your fair share of infographics online, as they tend to be visually engaging and contain “link worthy” or “share worthy” material.
Why are infographics “share worthy”?
Infographics are able to show complex information quickly and clearly, similar to maps, signs or charts. Today, being able to comprehend information in a matter of seconds is essential, since the average attention span is approximately 8 seconds – shorter than the attention span of a goldfish. Infographics create a new way of visualizing data and are able to display complex ideas in a clear, quick and attractive way.
Why should you use infographics in your content marketing strategy?
Potential to go viral
Infographics are more likely to be shared on social networks and become viral than ordinary text content. Infographics tend to be portable or embeddable as well, so other people can put an embedded code on their WordPress blog or website. This then creates an automatic link from their website to yours and your infographic will enjoy even greater reach and engagement!
Create brand awareness
This is a simple yet effective benefit of infographics that many overlook. If you create an infographic with your logo embedded into it and your brand prominently displayed, you’ll have a great opportunity to easily create brand awareness.
Encourage higher SEO results
The nature of the infographics means that people will link it back to your site. Google will then index your website higher as your site benefits from these backlinks, which will increase the visibility of your website in the eyes of searching consumers. Basically, infographics can help your website appear in online searches more frequently, if done correctly.
Demonstrate that you are an expert
To create an infographic, a good amount of research must be done. The information you consolidate and the data you incorporate into your new infographic will show your knowledge and position you as an expert on the topic.
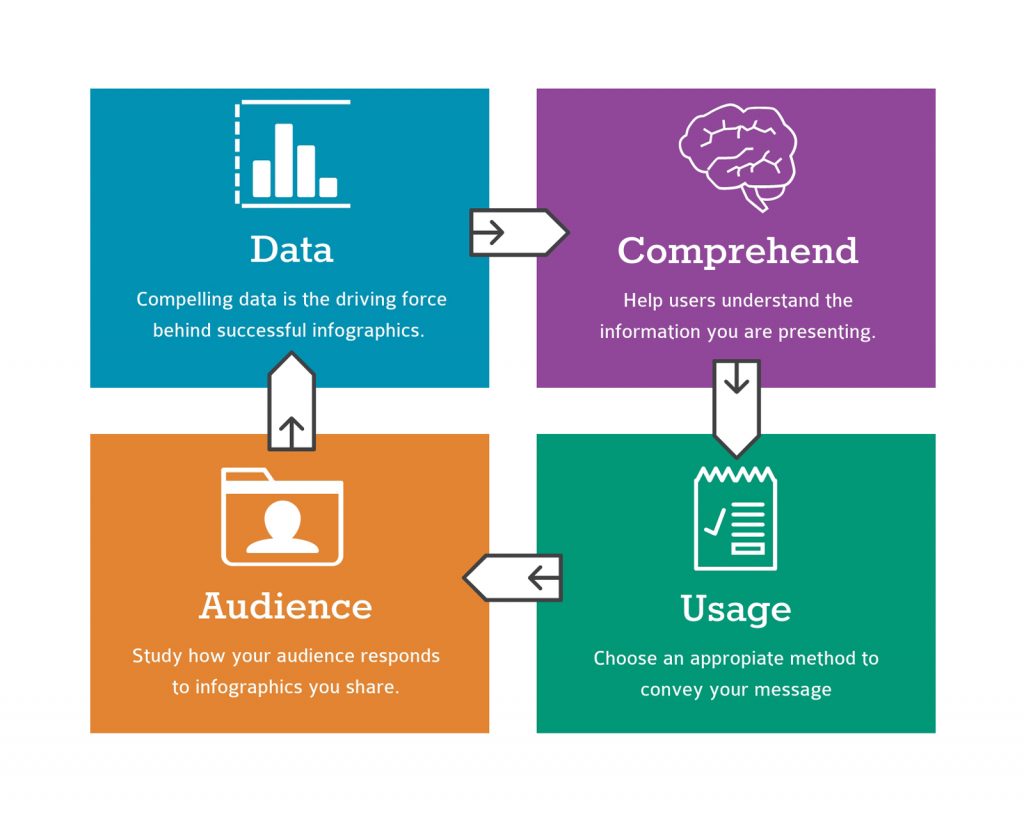
Before beginning, ask yourself these four questions:
1. Is there data?
A successful infographic has a lot of data and the graphic helps illustrate the points the data is making. What is more compelling: reading a fact described through a long block of text and numbers or viewing a simple eye-catching graphic? Just having data however, isn’t enough. There needs to be enough compelling data so the graphic is effective.
2. Is the information difficult to understand in written form?
Infographics are a clever way to communicate data that is hard to comprehend in written form. If you think about it, charts and graphs were created because it was difficult for people to read and parse numerical data that was written out. Beyond statistics and metrics, infographics also help when talking about chronology. Building a timeline and illustrating it with an infographic can create a visual reference for time and history.
3. How many infographics have you used so far?
It’s important to take the time to reflect on what you’ve done in the past so you don’t become a broken record. You want to keep things interesting for your audience by switching up the medium you use when distributing content. If you have done multiple infographics in the past, try something new and make sure to use other forms to distribute content.
4. Does your audience like infographics?
This is something that will need to be measured over time, but try to pay attention and take note of the reactions you receive from the infographics you use. Are the infographics getting shared? What are the reactions? Who is sharing them? It’s important to dive a little deeper in the “who” part. If infographic content isn’t being shared among your target audience, then it’s not achieving your end goal.
How to create an infographic
Creating infographics can be challenging, but a well-made design can go a long way toward your success. There’s no need to panic if you don’t know how to make an engaging infographic. There are several tools and platforms that make creating them a little easier such as Visually, Canva and Piktochart.
Once you have chosen a platform, keep these tips in mind to create a successful infographic:
Browse around
Take a look at some of the infographics that have already been made that relate to your field, so that you can create an infographic that stands out and performs well. A good place to find thousands of infographics is Pinterest. Take a look to see what infographics have been pinned the most and see what kind of visual content appeals to people.
Brainstorm a great idea
What is the purpose or main point to your infographic? Is it going to be funny, serious or shocking? No matter what you choose, your underlying goal should always be to educate and inspire your audience.
Fact check your data
After you come up with a message for your infographic, research relevant, unique and interesting data. Make sure the sources you choose are reputable and credit them at the bottom of the image. Don’t forget to fact check, and make sure that you haven’t made any errors in your research or transcribed statistics or metrics wrong from the source to your design.
Create a simple and consistent design
Simplicity is key when making an infographic, since you want your audience to quickly comprehend complex information. Try to limit the number of fonts that you use, and instead stick to one consistent style for your visual media. You should also aim to follow a single, consistent color scheme.
Tell a fascinating story
The data you choose should help back up your main story. An infographic shouldn’t just be a collection of facts. Each piece of information should add to the main narrative and advance the overarching message that you’re trying to get across to customers and clients.
Choose the right size
When you are trying to engage your audience, you have to think of website loading times as it plays an important role. Use an .SVG .JPG or HTML format to reduce the “weight” of the infographic so the page loads quickly. For specific sizing dimensions for your infographic, read our Social Media Image Size Cheat Sheet blog!
Optimize for sharing
As we previously mentioned, infographics can drive a lot of traffic to your website. You must embed it in a blog post, optimize it for sharing and share it on your company social media platforms.
How to measure the success of an infographic
You put a lot of time, research and effort into creating your infographic, so be sure to measure the success after you post it live. Social shares, page views, reposts, backlinks and more are all part of measuring the success of an infographic. Remember – you don’t want to miss this step because you won’t be able to improve what you don’t measure!
If you want to create an infographic and need a little more inspiration, browse through our blog for excellent examples. For further inspiration to help you get started, Piktochart has all kinds of ideas you can use right away. Still not confident? Give us a call and let our digital design team go over some options and create a compelling new graphic for you. Finally, no matter what, have fun during the process and make your information beautiful and engaging for your audience!