This post is your ultimate guide to Facebook Insights, the social network’s comprehensive analytics platform, and all of the various tools packed inside. In the sections below, we’ll:
- Walk through each and every page, tab, section, and graph of Facebook Insights.
- Go over how to read the data that’s provided.
- Provide actionable tips that you can use in your own Facebook marketing.
Some of the analytics tools out there seem intimidating and complicated, but Facebook Insights is an easy-to-use, easy-to-understand solution that can turn even the least social media-savvy person in your organization into a social analytics expert.
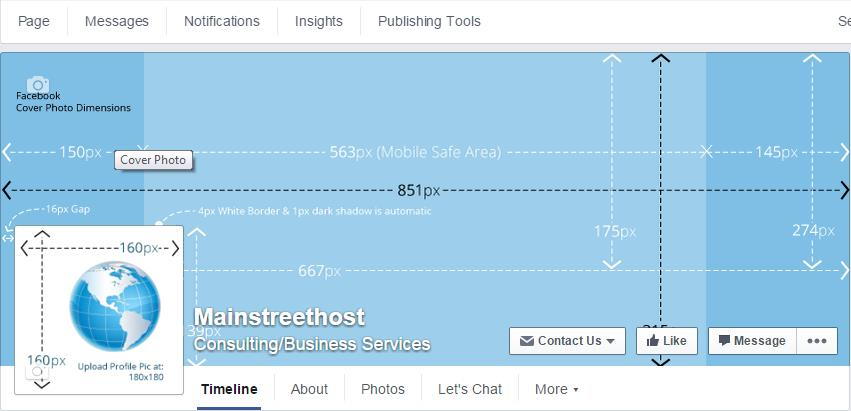
As a Page administrator, you should see something similar to the image below. To get to your analytics, click the Insights menu tab above your cover photo.
Once inside Facebook Insights, let’s look at the tab options on the left. Right now you’re on the “Overview” page. The other options are “Likes,” “Reach,” “Page Views,” “Posts,” “Videos,” “People,” and “Shop.”
But let’s start at the beginning.
Overview
You’ll notice a bar above the graphs that gives you the specific date range the data is from. On this page, these dates cannot be adjusted from the current week-long period. Once we move on from the Overview we’ll discuss other pages that allow you to select your own date range.
Facebook Page Statistics
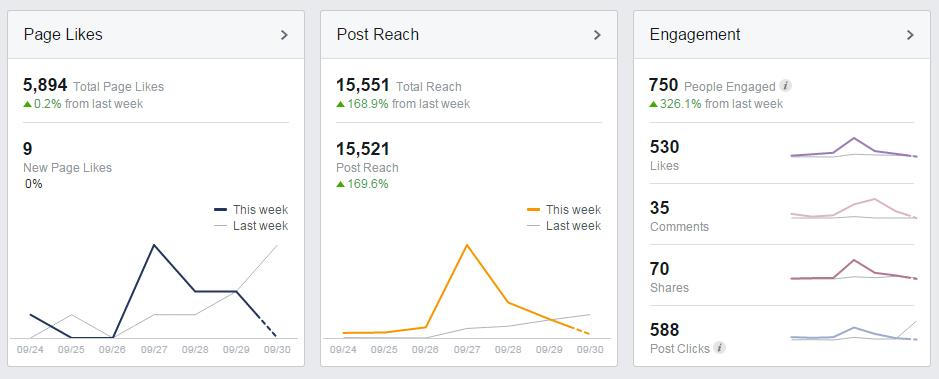
The first section gives a general look at statistics for recent “Page Likes,” “Post Reach,” and “Engagement.”
Just as a general review:
- Page Likes shows the people that followed your Page – again, only within the roughly week-long timeline. Your total likes are shown here as well. Building up your Page’s followers is important because you need them for your content to be spread.
- This leads us to the next section, Post Reach. The reach of each post is determined by the number of people that actually sees the content you’re publishing. A recent study done by Locowise determined that organic reach (reach that is not paid for via boosted posts) is around 7% of a Page’s total likes/followers – meaning, if you have 100 Facebook followers, only 7 of them see the posts you put up.
- And then there’s the Engagement data, which comes from likes, comments and shares.
All three of these sections tie together. Page likes help with your post reach – and with increased engagement, that reach can expand to people beyond just your followers. Think of engagement like exponential growth. If one follower shares a post, a selection of their followers will then see it. If one of them shares it, their followers will see it as well, and so on.
If you would like to learn more about how to increase your organic reach on Facebook for free, click here.
Your 5 Most Recent Posts
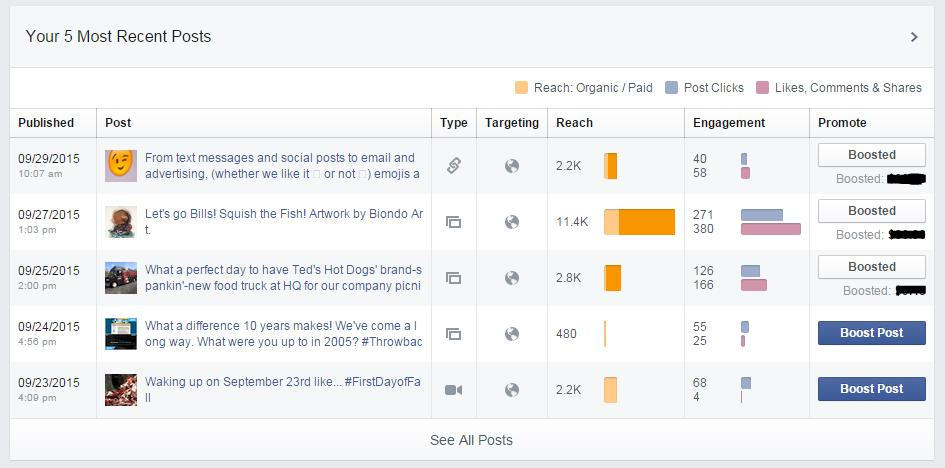
Beneath these three graphs on the overview page are “your 5 most recent posts,” showing post reach and engagement for the last five pieces of content you put on your page.
Use this area to gain insights into what had better engagement and, therefore, what you should post more of in the future. If your audience isn’t responding to sales-pitchy content, it’s time to start posting more of what they are responding to.
If we look at this example from Mainstreethost’s Facebook Insights Overview page, we can see that under “Reach” there are orange bars with two different hues. The lighter orange represents organic reach and the darker orange shows reach that was achieved through boosting. After posting content, you always have the option to boost it with a little cash and push it out to people who would not normally see it. As you can see, Mainstreethost boosted three of our five most recent posts in this example, but it’s certainly not a requirement – there are successful Facebook accounts that don’t boost at all and still see significant engagement.
One important conclusion we can draw from the posts above concerns the organic reach from photographs versus videos. The photo posted on September 24 reached about 480 people organically, and it had great engagement with 55 post clicks and 25 likes/comments/shares. But if you look at the video (in this case, a GIF) posted the day before on September 23 you can see the organic reach soared to 2.2K.
The importance of videos for organic reach was looked at by Socialbakers, now Emplifi, which found that video actually had a higher reach potential than any other type of content, including photographs. This research, combined with real-life evidence (like the reach of our posts above), should influence future content choices for content.
Action Item: Try posting a video natively and see how it performs compared to other types of content!
We’ll talk more about native videos when we get to the Video page!
This is just one example of how important analytics are for the future of your Page. Based on these conclusions, an account that continued to post photograph-only content would essentially be banging their heads against the post reach wall.
Pages to Watch
Moving down to the last section of the overview page, “pages to watch” facilitates comparisons between your page and others you want to keep an eye on.
Some good pages to add here would be those of your competitors and leaders in the industry (organizations whose success you want to emulate).
Check back here frequently to see how you measure up, and take a look at the type of content they’re posting – there’s always something to learn from other experts.
Now that we’ve covered the Overview page, it’s time to dig a little deeper – starting with the next tab in the menu bar.
Page Likes
This tab tracks overall Page likes, not likes to specific posts, so this is your total number of followers.
Action Item: Keep an eye on the days your Page likes increase and decrease, and try to identify factors that could have contributed to the trends.
Remember when we mentioned that some Insights pages will let you customize the date range for your data? This page and all of the following tabs have this feature. On the current one, this is especially useful in narrowing down when and why a spike in likes may have occurred.
This feature can also help you identify the opposite type of trend. If you launch a campaign and don’t see any significant changes, it may be time to reevaluate how the campaign was disseminated or the effectiveness of the campaign itself.
Similarly, a spike in “unlikes” could be a sign of over or under-posting. You don’t want to post so much content that you’re becoming a nuisance to your followers, but you also want to be consistently active. If your Page is silent for too long, people may unlike because they believe there’s nothing to see there.
Net Likes
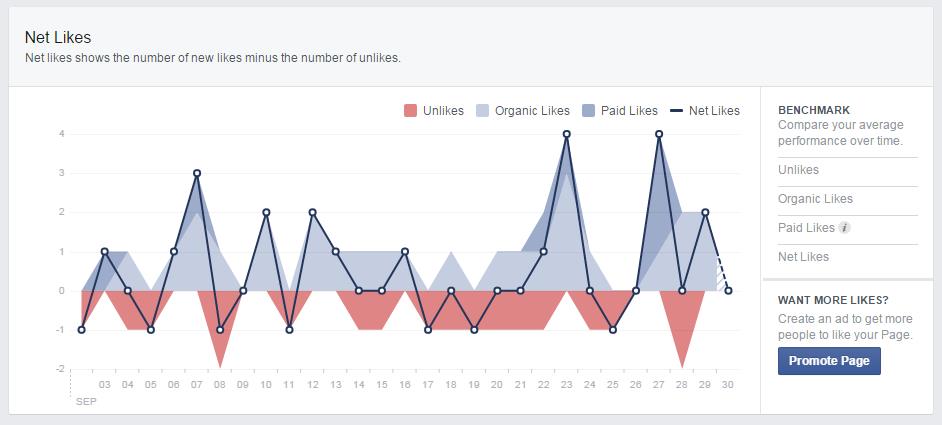
The flux of likes and unlikes on your page can be seen in the next section – “Net Likes.”
The net likes graph allows you to customize your data. Clicking on the different “benchmarks” on the right-hand side filters out data you don’t want to see, so you can focus on what’s most important. For example, if you launched a sponsored Facebook Ad and wanted to see if it resulted in increased likes to your Page, simply click the “Paid Likes” option to view how many followers can be attributed to your campaign.
Changes to the data timeframe mentioned above will filter down throughout the entire page. So if you want to view paid likes within a certain date range, change the dates at the top of the page.
Where Your Page Likes Happened
The last section is “Where Your Page Likes Happened.”
Knowing where your followers are interacting with your Page is crucial. This data cannot be ignored because it tells you where you can focus your energies to reach people where they already are. If you see that your account gets a majority of its Page likes from Facebook Ads, for example, your future Ads should become a priority.
One way you can optimize your Ads is by gearing them towards mobile.
Action Item: Make sure there are easy ways for mobile users to get to your website from your Ads and, most importantly, that your website is mobile-friendly.
Another thing to keep in mind – Facebook on mobile cuts off the text of posts that are too long, so make sure you keep yours to under 160 characters. This will make sure followers don’t have to click “See More” to finish reading your post. If your post must exceed that 160 character limit, make sure the most important info is in the top margin.
Here are some tips from Social Times on how to make your Facebook posts mobile-friendly.
Now let’s take a look at the next tab – where you can analyze the reach your posts get.
Post Reach
We’ve already touched on what post reach is as well as the differences between the organic and paid kind. This tab lets you dig deeper into what your reach numbers really mean. Again, the timeline of this data can be adjusted. You can use this tool to look at many different aspects of post reach, including:
- If you’ve revamped your social media presence and want to see the effect of your recent efforts.
- If you want to experiment with some boosts for posts, starting out with small monetary contributions and monitoring how post reach is affected.
- If your content over a certain period was lacking some originality and reach suffered, you can point to that timeframe as empirical evidence that some changes in strategy need to be made.
Post Reach for a Specified Time Range
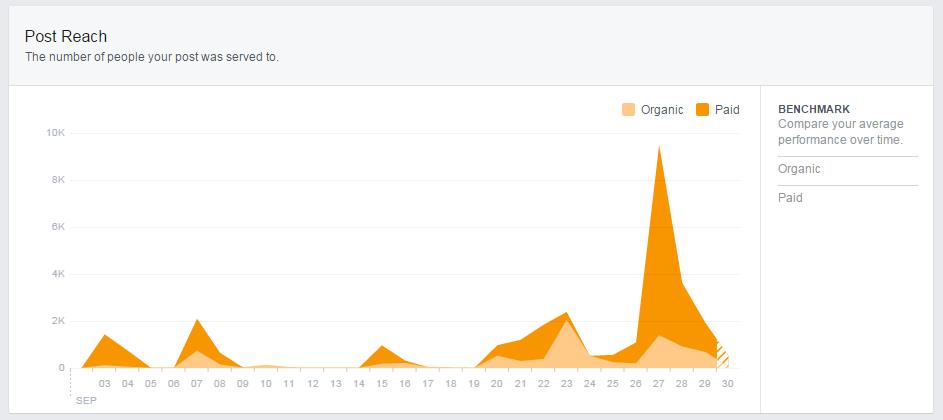
This is a general overview of post reach during a specified time range.
Here, again, we can clearly see the difference between paid and organic reach results. Just like on the previous page, the benchmarks on the right-hand side can be selected to customize your graph.
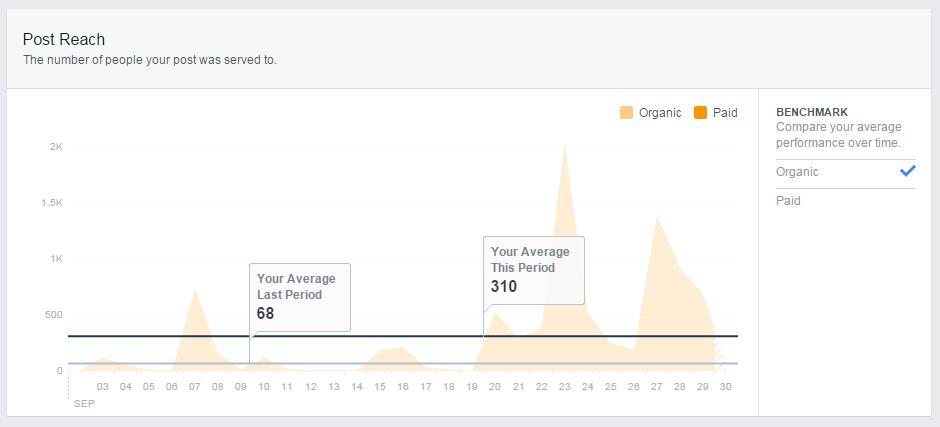
Action Item: If you want to look at organic reach only, simply click on that benchmark to make the paid reach disappear.
If you’ve paid for boosted posts, you’ll notice that the spikes in the graphs change when only the organic benchmark is selected. This happens because the paid benchmark’s reach data is not providing any information. This is especially important to remember when it comes to paid reach spikes like the one we see below. A spike this big can distort the entire graph!
Compared with the giant spike, our organic reach looks insignificant and almost non-existent. But the graph looks this way because paid reach numbers are often outliers (and definitely are in this case) – this means the paid reach data is so far above the normal reach numbers, it pollutes the rest of the graph.
Action Item: Take the paid reach data away using the customizable graph tool, and you’ll see that the new spikes in organic reach represent more clearly the impact of un-boosted content.
Likes, Comments, and Shares
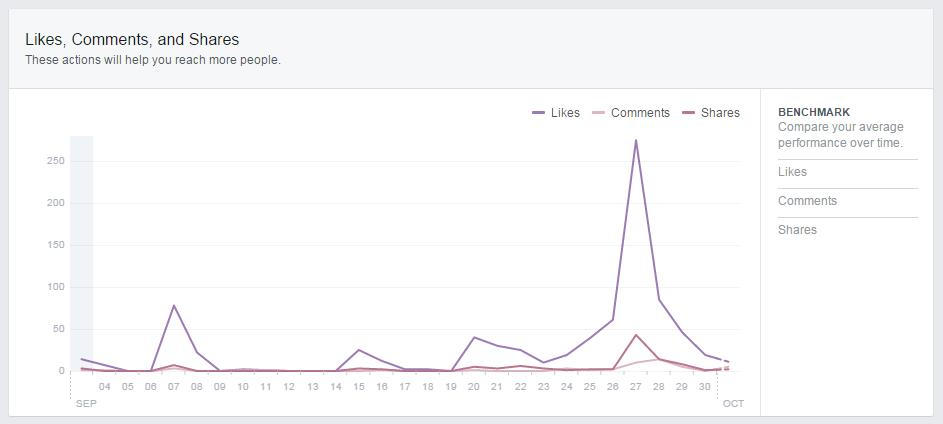
The next section shows the “Likes, Comments, and Shares” from your page.
You’ll notice at first glance that the spikes on this graph closely mirror those on the previous one. In this case, the large spike in post reach from boosted content resulted in an increased amount of engagement with the page. This is normal and, in fact, is one of the main reasons why people boost their content.
Likes, comments, and shares are indicative of a popular and successful Facebook Page that engages well with its followers. But these engagement factors also help spread your content to people who would not normally see it. This goes back to the exponential growth we talked about earlier.
Hide, Report as Spam, and Unlikes
Below these engagement factors is a chart showing “Hide, Report as Spam, and Unlikes” statistics.
While organizations should always be receptive to what their followers think about their social presence, we would urge you not to put too much weight on this data. Of course, this is only true of accounts that are not spamming their followers, posting inappropriate content, or not posting at all.
All of those behaviors (among others) will result in hidden content, unlikes, and spam reports. But generally speaking, you can’t obsess over each and every person that unfollows your Page. Unlikes are going to happen, and unless this number reaches an alarming magnitude, it’s best to move on and focus on the followers that do want to see your content.
Action Item: Pay attention to patterns that emerge – spikes in unlikes could be the result of a specific and easily fixable practice.
With the next tab, we can take a closer look at what those followers are interested in.
Page Views
This part of Facebook Insights shows us what people are clicking on once they’re on your business’ Page.
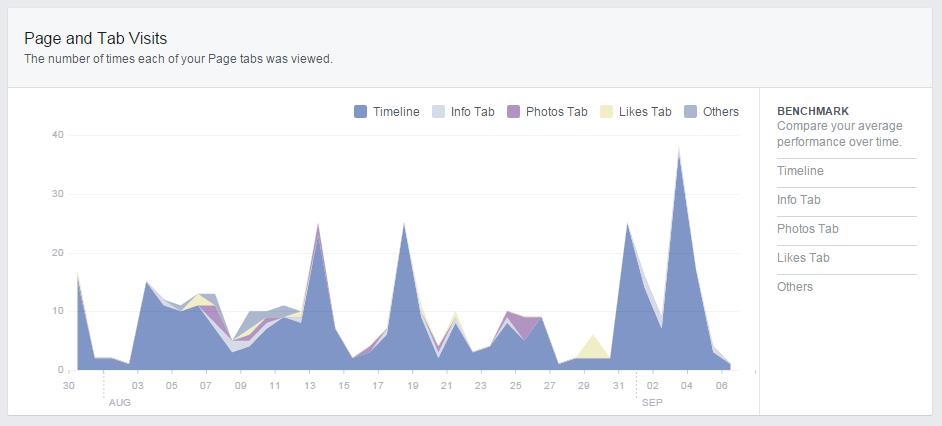
Page and Tab Visits
With the helpful benchmarks on this graph we can see how many clicks our “Timeline,” “Info Tab,” “Photos Tab,” and “Likes Tab” received on any given day. This is useful if you have a specific area you want your followers to pay more attention to. If the most important part of your Facebook profile is your photographs, the photo tab benchmark will show you if users are actually viewing them.
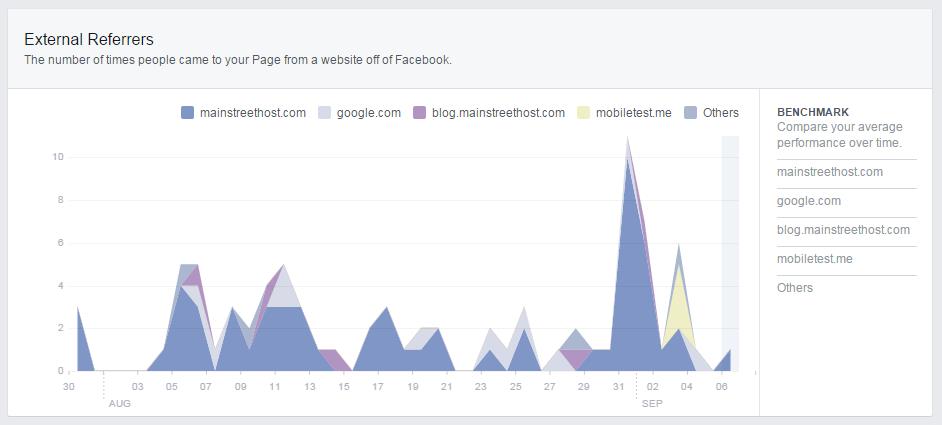
External Referrers
External referrers are places on the web that lead visitors to your Facebook Page. Knowing where people are likely to find your Page can help you plan future marketing campaigns. You probably have a website, and may even have a blog or other peripheral page – now you can see if these actually send people to your profile.
Action Item: If your website is not generating any traffic for your Facebook, you can include prominently-placed social media icons after articles and on main pages that encourage customers to interact with you on your various accounts.
This interaction and cooperation between websites and social media accounts is very important in today’s digital world. Make sure your website and Facebook Page are in sync.
The following tab is where we’ll delve into the content we’re posting (and when we’re posting it).
Posts
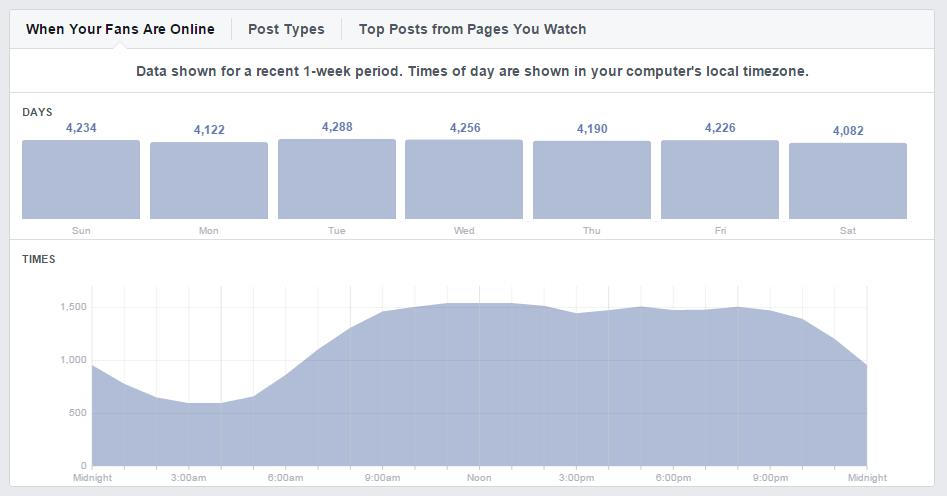
When Your Fans Are Online
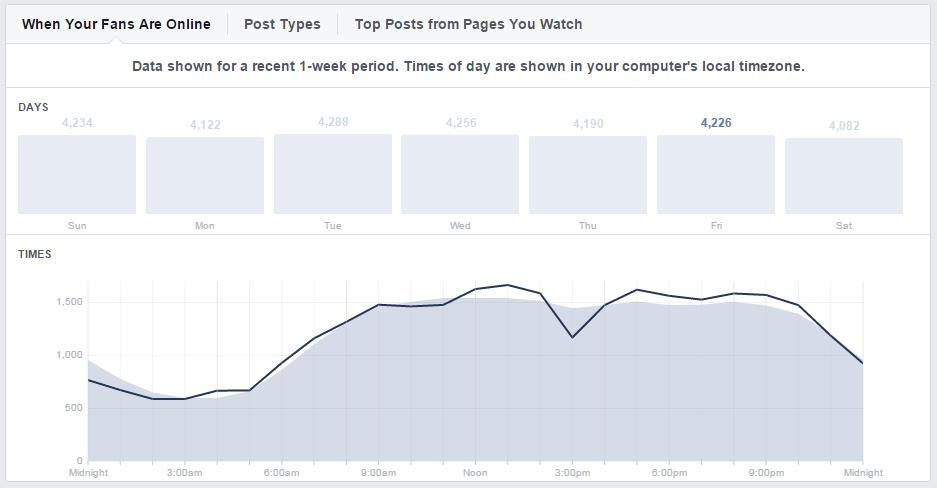
Even experienced social media marketers skilled with analytics tools sometimes fail to take advantage of data telling them what times their followers are online. This section makes optimizing your post time easy with a very simple chart that graphs the times your followers are on Facebook.
Action Item: Adjust the scheduling times for your posts to coincide with times when you see peak online activity.
The highest points on the graph are the times when you should be scheduling your content.
If you want to get really technical, drag your cursor over the specific days to get the peak times on that particular day.
This area also has two other components, which you can select at the top of the section.
Post Types
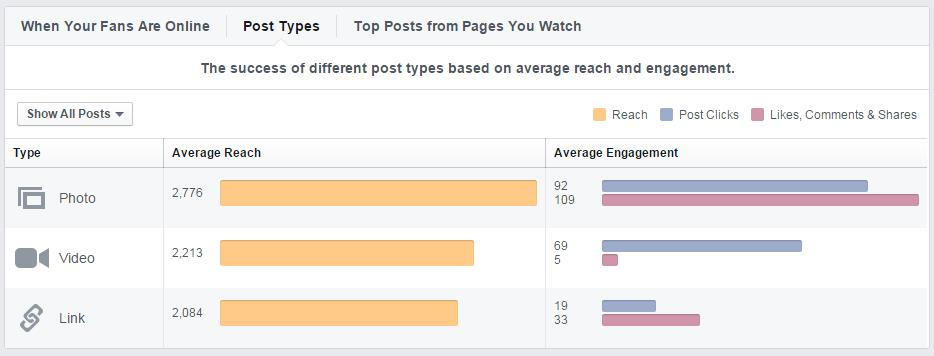
As you can see, this handy horizontal bar graph shows you which types of content you typically use in your posts.
For each type of content, we can see the “Average Reach” as well as “Average Engagement.” Both of these parameters give us more insight into what type of content we should be posting. Earlier on we mentioned how video posts should receive the highest amount of post reach, but here it’s clear that photographs are still extremely important to our page. This is valuable information, since we now know that both photographs and videos are important aspects of our future social media campaigns.
Action Item: Each Facebook Page is different, so check your statistics to see which types of content are most successful for you.
Top Posts from Pages You Watch
Like the name suggests, this area shows you how posts from your watched accounts are doing. You can (and should) compare these insights to your own posts. Again – watch and learn from the best in your industry to optimize your own efforts on Facebook.
Specific Posts On Your Page.
This is where we can get a more detailed look at what the Overview started to show us about individual posts.
Action Item: Using everything you’ve learned so far, you should be able to look at this comprehensive list and see what is performing well and what isn’t.
The next tab shows more analysis of video content.
Videos
This is a relatively new addition to the Facebook Insights tool, and was introduced as a way for Facebook to prove the success of video content.
Facebook supports “native video,” which is a video that is posted directly to a user’s Page (as opposed to a video that is linked from YouTube). For example, if you shoot footage on your phone and upload it straight to your Facebook Page – you have created a native video.
Facebook’s algorithm, of course, favors native video over content from competitors like YouTube. And this is evident in the organic post reach native videos receive. Think back to the Overview page when we saw our native video reached 2.2K people.
The takeaway – native videos are much more likely to be favored over external video.
Action Item: To make sure people are viewing as much of your videos as possible, keep them short and sweet!
People
We hope you didn’t forget about the most important aspect of any marketing tactic – your audience!
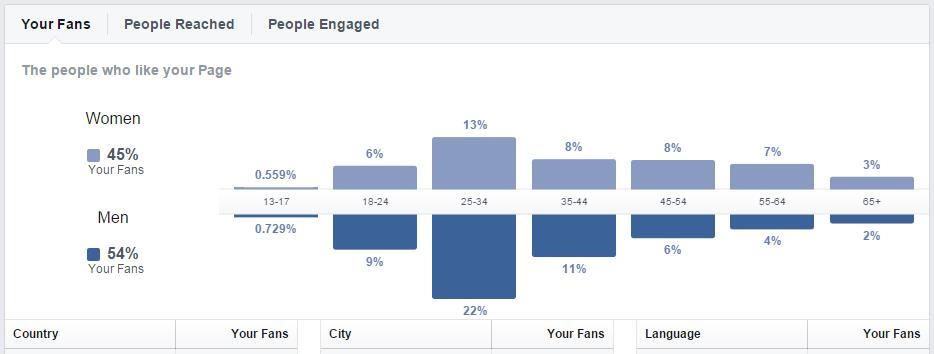
Your Fans
You might think you know your business’ biggest audience, but are you seeing the same people on your Facebook Page? Your target audience and Facebook audience should be pretty similar. If they’re not, you know your Facebook marketing is not reaching the people you want it to and is, therefore, not as effective as it could be.
Of course, it’s always nice to reach a different demographic. But you also need to make sure your main customer base is interacting with your Page.
Action Item: Paid boosting and Facebook Ads can help you catch your audience’s attention by letting you customize who that content goes out to and where it goes out.
People Reached and People Engaged
These last two data sets provide the same sort of insight as the one above and will let you know if you’re missing the mark with your Page’s content. “People Reached” looks specifically at the demographics behind your post reach while “People Engaged” focuses on the ones actively liking, commenting and sharing.
Shop
This last tab is new and specific to Facebook Pages that offer an element of ecommerce.
Action Item: If you’re interested in incorporating your products on your Facebook Page, click here to learn how.
As for the Shop tab on Insights, simply select a date range to see the number of views, clicks, and purchases that resulted from adding products to your Page.
And Finally…
All of this may seem like more than you ever wanted to know about your Facebook Page and audience. But familiarizing yourself with the various graphs and data sets will help you make important decisions about the future of not just your Facebook marketing, but also your business itself.
Facebook Insights is an extremely valuable tool, offered to us free of charge. All it takes is a little practice and deductive reasoning to turn insightful analytics into innovation. And after making it through this post, you’re already well on your way to becoming a social analytics expert!

